
Are Solar Panels Worth It? Payback Period Explained
On this page
“Solar panels pay for themselves” is a claim you will hear a lot. The honest answer is: often yes, but over years rather than months, and the exact timescale depends heavily on your roof, where you live and how you use electricity. This guide explains how payback is actually calculated, works through a realistic example using current verified prices, and sets out the factors that can stretch payback well beyond the headline figures — so you can test any installer’s numbers for yourself.
What “payback period” means
The payback period is simply the upfront cost of the system divided by the value it gives you each year. That annual value has two parts:
- Bill savings — electricity you generate and use yourself, so you do not have to buy it. Every unit you use directly is worth the full price you would otherwise pay. Under the Ofgem price cap for October to December 2026, the average electricity unit rate for a Direct Debit customer is 26.32p per kWh.
- Export income — surplus electricity you send to the grid, paid through the Smart Export Guarantee (SEG) or a similar export tariff. Suppliers with more than 150,000 customers must offer an export tariff, but they set their own rates, which must only be above zero. Standalone SEG rates can be as low as 3p–6p per kWh, while tariffs tied to taking your import supply from the same provider commonly pay around 12p–15p per kWh. The Energy Saving Trust describes around 12p per kWh as typical.
This gap between the two values is the single most important thing to understand: a unit you use yourself is worth roughly twice what a typical exported unit earns. That is why how much of your generation you use — your self-consumption — matters so much. If you are unsure how your bill is built up, our explainer on how to read your energy bill is a useful starting point.
A worked example
Take a typical installation, using figures from the Energy Saving Trust and Ofgem:
- System: 4.5 kWp, the Energy Saving Trust’s average domestic size
- Installed cost: £7,600 (the Energy Saving Trust average, at 0% VAT, which applies to home installations until 31 March 2027)
- Annual generation: around 3,800 kWh. A well-sited UK system typically generates roughly 800–1,000 kWh per kWp per year depending on location and roof direction, so 4.5 kWp in a middling location sits around this level
- Self-consumption: 50% used in the home, 50% exported — a reasonable middle assumption for a household out for part of the day
- Import price avoided: 26.32p per kWh (October–December 2026 price cap)
- Export rate: 12p per kWh
Now the sums:
- Self-used electricity: 1,900 kWh × 26.32p = about £500 a year saved
- Exported electricity: 1,900 kWh × 12p = about £228 a year earned
- Total annual benefit: about £728
- Payback: £7,600 ÷ £728 = about 10.4 years
That result lines up well with the Energy Saving Trust’s own estimates. Using July 2026 fuel prices, it estimates annual savings including export payments of around £740–£810 for a four-bedroom detached home in Manchester, £900–£930 in London and £680–£740 in Stirling, with payback periods of roughly 9 years in London, 10–11 years in Manchester and 11–12 years in Stirling. Note how much export payments matter: without them, the bill savings alone in its examples fall to roughly £190–£330 a year, which would push payback out dramatically. Always check whether a quote’s savings figure includes export income, and at what rate.
What makes payback shorter or longer?
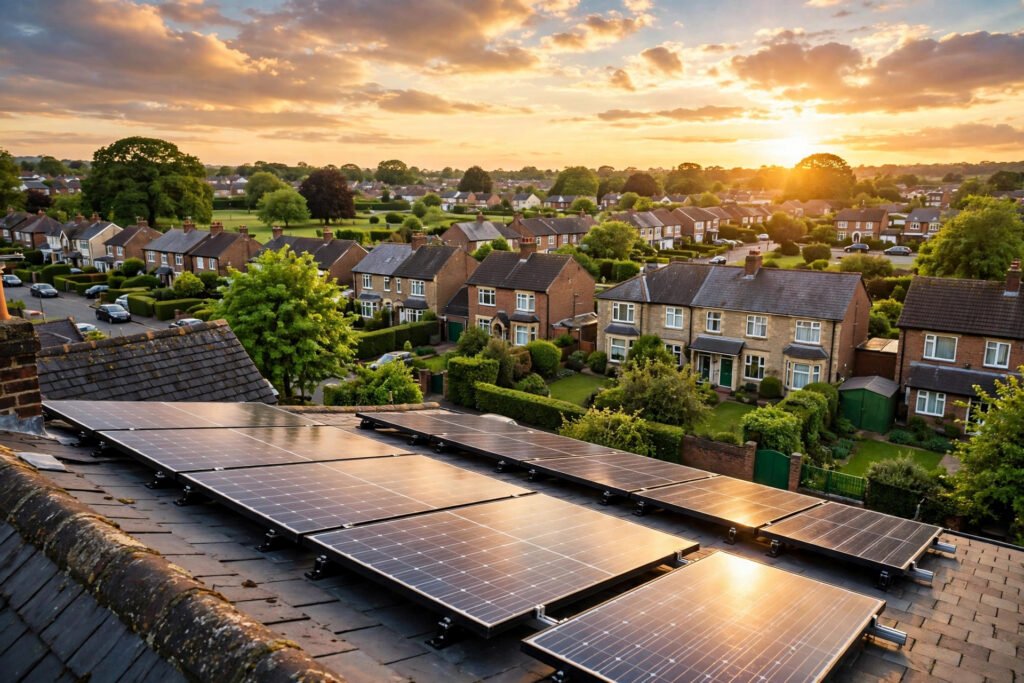
Where you live. Southern homes generate more than northern ones from the same system, which is why London paybacks are shorter than Stirling’s in the estimates above.
Your roof. A south-facing, unshaded roof at a good pitch generates the most. East- or west-facing roofs typically produce around 15–20% less, and shading reduces output further. Your installer should give you a site-specific generation estimate, not a national average.
When you use electricity. Households at home during the day — home workers, retirees, families with young children — naturally use more of what they generate. If you are out all day, shifting appliances such as the washing machine and dishwasher to run on timers at midday raises self-consumption for free. Our round-up of what uses the most electricity at home helps you find the loads worth shifting.
Your export tariff. Moving from a 4p standalone rate to a 12p–15p tariff roughly triples export income. Shopping around for export deals is one of the easiest wins after installation, and it costs nothing.
Future prices. Payback calculations assume today’s prices. If electricity prices rise, payback shortens; if they fall, it lengthens. Treat any single figure as an estimate, not a promise.
Costs along the way. Panels should last 25 years or more, but the inverter typically needs replacing after around 12 years, which adds a cost partway through the system’s life. Honest payback estimates should either include this or flag it.
What about adding a battery?
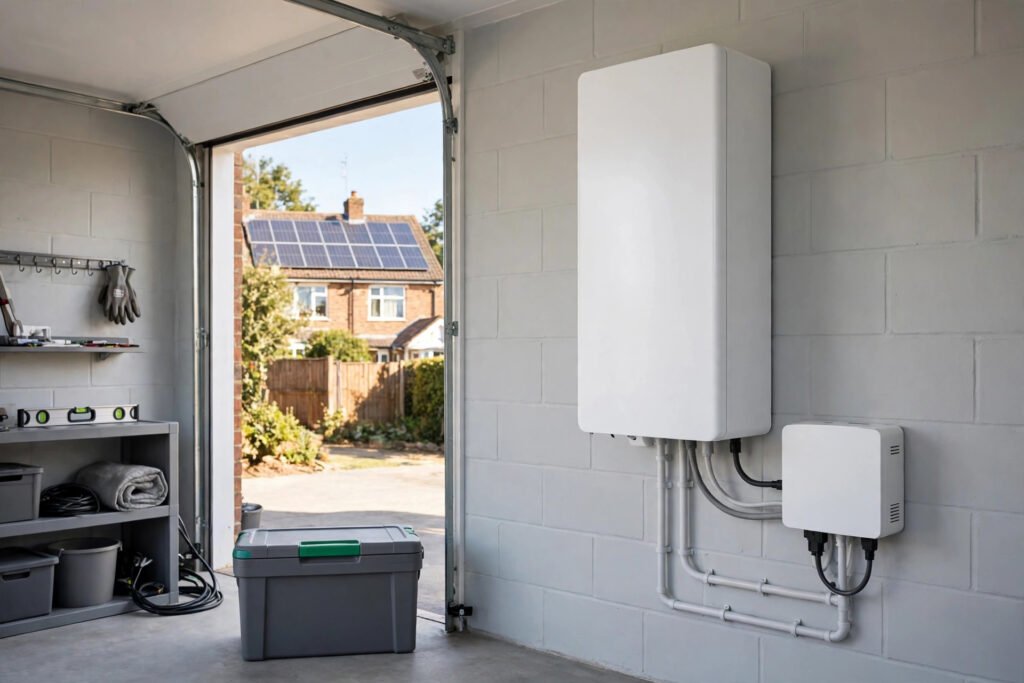
A battery raises self-consumption by storing daytime surplus for the evening, but it also adds several thousand pounds to the upfront cost. Whether it shortens or lengthens your overall payback depends on the gap between your import price and export rate, and it often lengthens it. We work through the numbers in detail in our guide to solar battery storage costs. If cost is your priority, also compare the system price itself against the benchmarks in how much solar panels cost — overpaying by £1,000 adds well over a year to payback on the example above.
Conclusion
On current prices, a typical UK solar installation pays back in roughly 9–12 years depending on location and usage, then continues generating for a 25-year-plus panel lifespan. That makes solar a long-term home improvement rather than a quick win. Run the calculation with your own generation estimate, your real export rate and a realistic self-consumption figure — and be sceptical of any payback claim that does not show its assumptions.
Frequently Asked Questions
What is a typical payback period for solar panels in the UK?
Based on Energy Saving Trust estimates using July 2026 prices, around 9 years in London, 10–11 years in Manchester and 11–12 years in Stirling for a typical 4.5 kWp system, including export payments. Your own figure could be shorter or longer depending on your roof, usage and tariff.
Do solar panels still save money if I am out at work all day?
Yes, but less, because more of your generation is exported at a lower rate than the import price you avoid by using it yourself. Running appliances on timers during the day and choosing a competitive export tariff both help close the gap.
What export rate should I assume in my calculations?
Around 12p per kWh is a reasonable middle assumption — it is the level the Energy Saving Trust describes as typical and matches several suppliers’ main tariffs. Standalone SEG tariffs without switching your import supply can pay as little as 3p–6p, so check the specific tariff you would actually join.
Will solar panels add value to my home?
Solar may make a home more attractive to some buyers because of lower running costs, but there is no guaranteed uplift in value, and estimates vary. Treat any house-price benefit as a possible bonus rather than part of the payback calculation.
Should I wait for panels to get cheaper?
Installed costs have already fallen substantially over the past decade, and home installations currently benefit from 0% VAT until 31 March 2027. Waiting also means years of savings forgone. If the numbers work for your home now, delaying purely in hope of lower prices is a gamble rather than a strategy.
[…] be enough on their own to justify the cost. If you have not already read it, our explainer on whether solar panels are worth it shows the same gap logic applied to the panels […]
[…] of electricity generated — provided you can actually use or export the extra power. Our guide to whether solar panels are worth it shows how to judge […]
[…] reward flexibility and integrate more wind and solar — part of the same system that decides whether solar panels are worth it for your roof. Those are collective benefits rather than money in your pocket, but they are […]